
Power BI Fabric’s Narrative Visualization is a game-changer for quickly summarizing your data without diving into the details. Here’s how to make the most of it:
- Open Your Report: Start with your Power BI report, selecting the dataset you want to analyze. For instance, we used a Microsoft-provided sample sales dataset from 2013-2014.
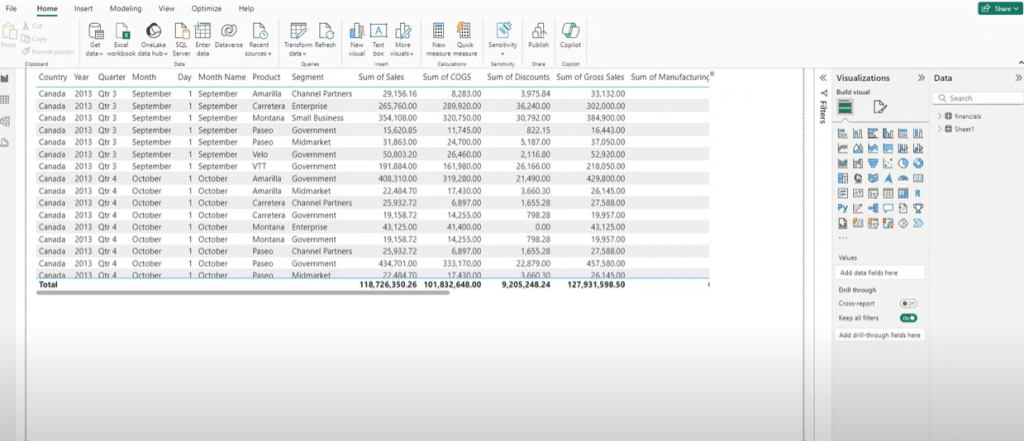
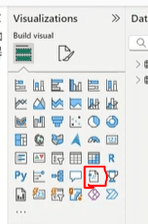
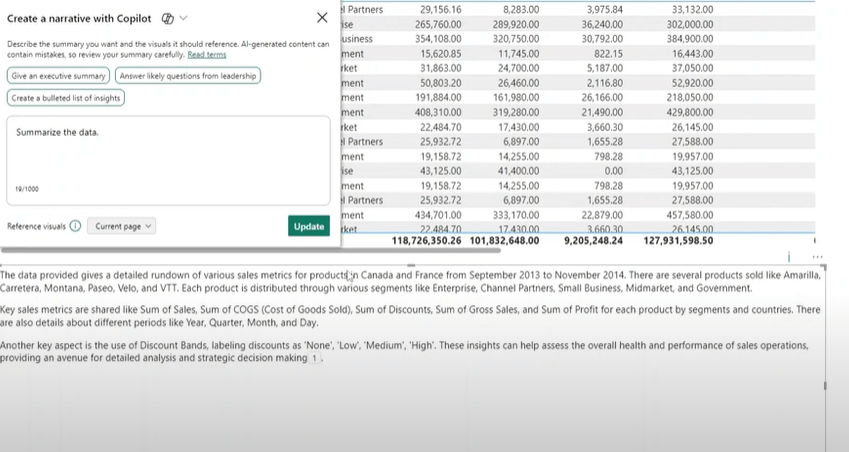
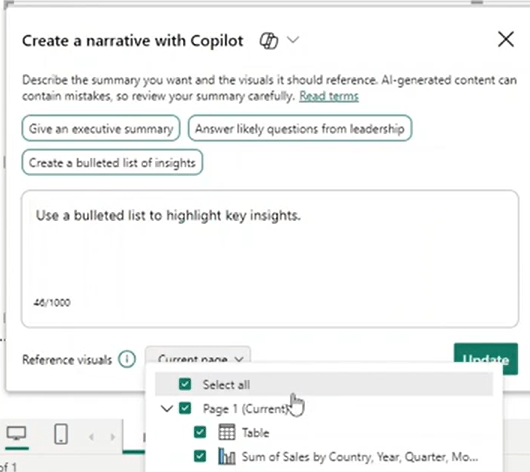
- Use Narrative Visualization: Locate the “Narrative” visualization and select it. The tool auto-summarizes your data, highlighting key metrics like regional sales over time.
- Customize Your Summary: Tailor the narrative to your needs. Whether you need an executive summary for a meeting or want to filter by specific dates, the prompts are flexible.
- Work with Multiple Visuals: If your report spans multiple pages or visuals, the tool adapts to summarize the selected data seamlessly.
Why Use It? The narrative visualization simplifies complex data, making it easier to generate and present insights without getting lost in the details. It’s perfect for quick overviews and streamlined reporting.
You can watch my live demo here:

Leave a comment